Curtailment in Brazil: Who Pays for the Energy the Grid Leaves Unused?
In the wind and solar plants analyzed, generation lost to curtailment rose 41.6% from one year to the next. Who decides, who pays, and how can the cost be reduced?
Imagine a sunny, windy Sunday in northeastern Brazil. Wind and solar power plants are capable of producing electricity, but demand at that time is relatively low. Some electricity can be transferred to other regions; some may have nowhere to go or may be impossible to accommodate under the system’s operating constraints. Brazil’s National Electric System Operator (ONS) then instructs certain plants to reduce their output.
The example is illustrative, but the phenomenon is real. It is known as curtailment. On October 6, 2026, the Brazilian Electricity Regulatory Agency (ANEEL) approved new rules for managing mandatory generation curtailment, following a public consultation process launched in 2019. The decision has brought renewed attention to a question that goes well beyond compensation payments: how should a power system be regulated when it can produce increasing amounts of renewable electricity but cannot always put that energy to use? [1]
To examine this question, Regulador.org analyzed two years of ONS open data and compared the findings with regulatory documents and economic theories of regulation. The purpose is not to pass judgment on the recently approved decision, but to understand the costs, risks, and incentives involved.
A recent real-world example makes this challenge easier to see. On Sunday, October 18, 2026, total load on Brazil’s National Interconnected System (SIN) was approximately 72.1 GW at noon. After subtracting the wind and solar generation recorded in the ONS energy balance, residual load was only 31.3 GW. By 7:00 p.m., as solar output declined and demand rose, residual load reached 77.0 GW, an increase of 45.7 GW in seven hours. This is the familiar shape of the duck curve. [2]
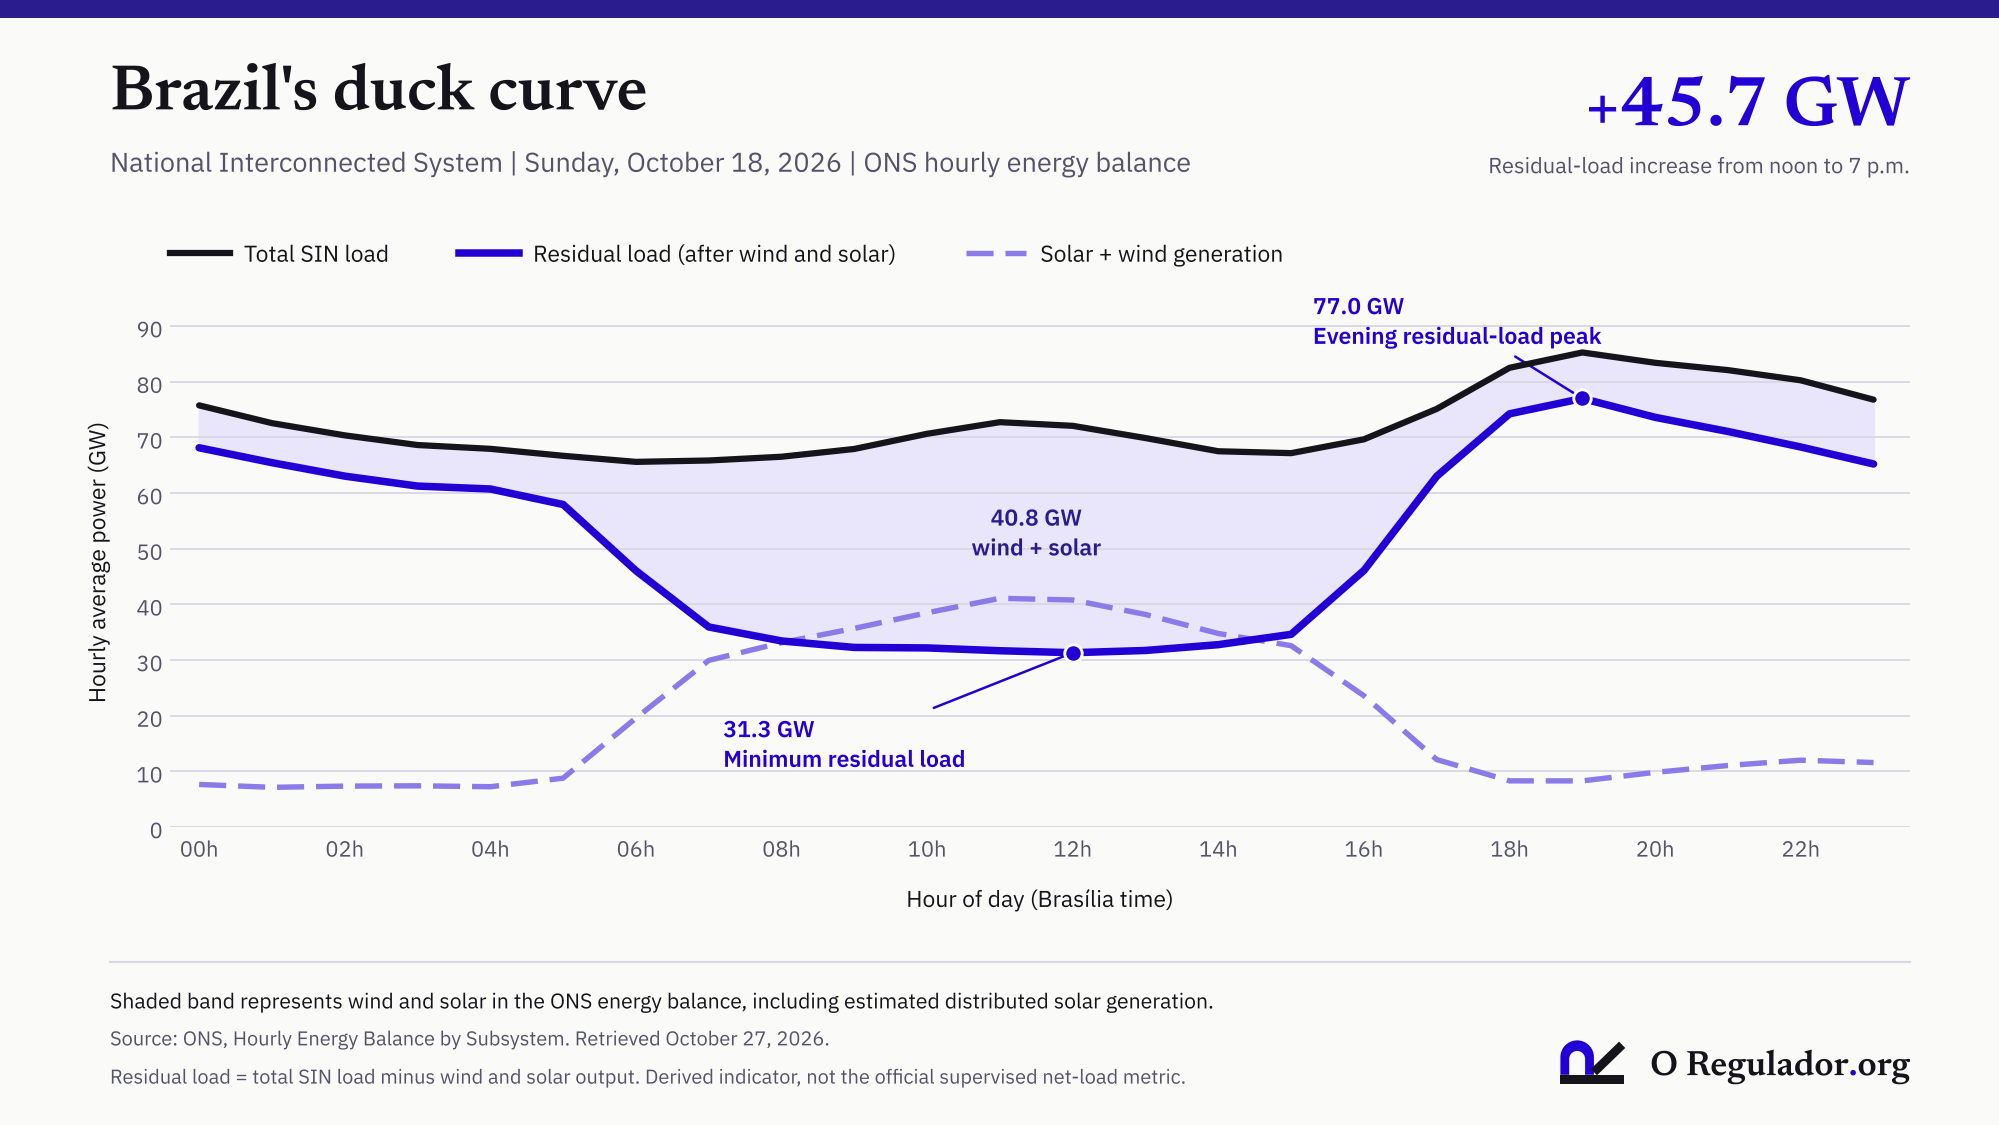
The figure illustrates the substantial flexibility needed between midday and the early evening. The gap between the curves is not, by itself, curtailed electricity: it represents wind and solar generation included in the energy balance. Actual curtailment must be evaluated separately, using the datasets discussed next. [2]
What Two Years of ONS Data Reveal
On October 26, 2026, we queried ONS datasets on wind and solar photovoltaic generation curtailment, covering October 1, 2024, through September 30, 2026. The analysis included approximately 7.86 million half-hourly records. The measure used was Geração Não Realizada Apurada (GNRa), or assessed unrealized generation, an operational estimate of the electricity that was not generated during curtailment intervals. Recorded average power was converted into energy using a half-hour duration for each interval. [3][4]
During the first 12-month period, GNRa for the wind and solar plants covered by these datasets totaled 29.20 TWh. In the second, it reached 41.33 TWh, an increase of approximately 41.6%. Wind generation curtailment rose from 19.95 to 28.66 TWh, while solar PV curtailment increased from 9.25 to 12.67 TWh. [3][4]
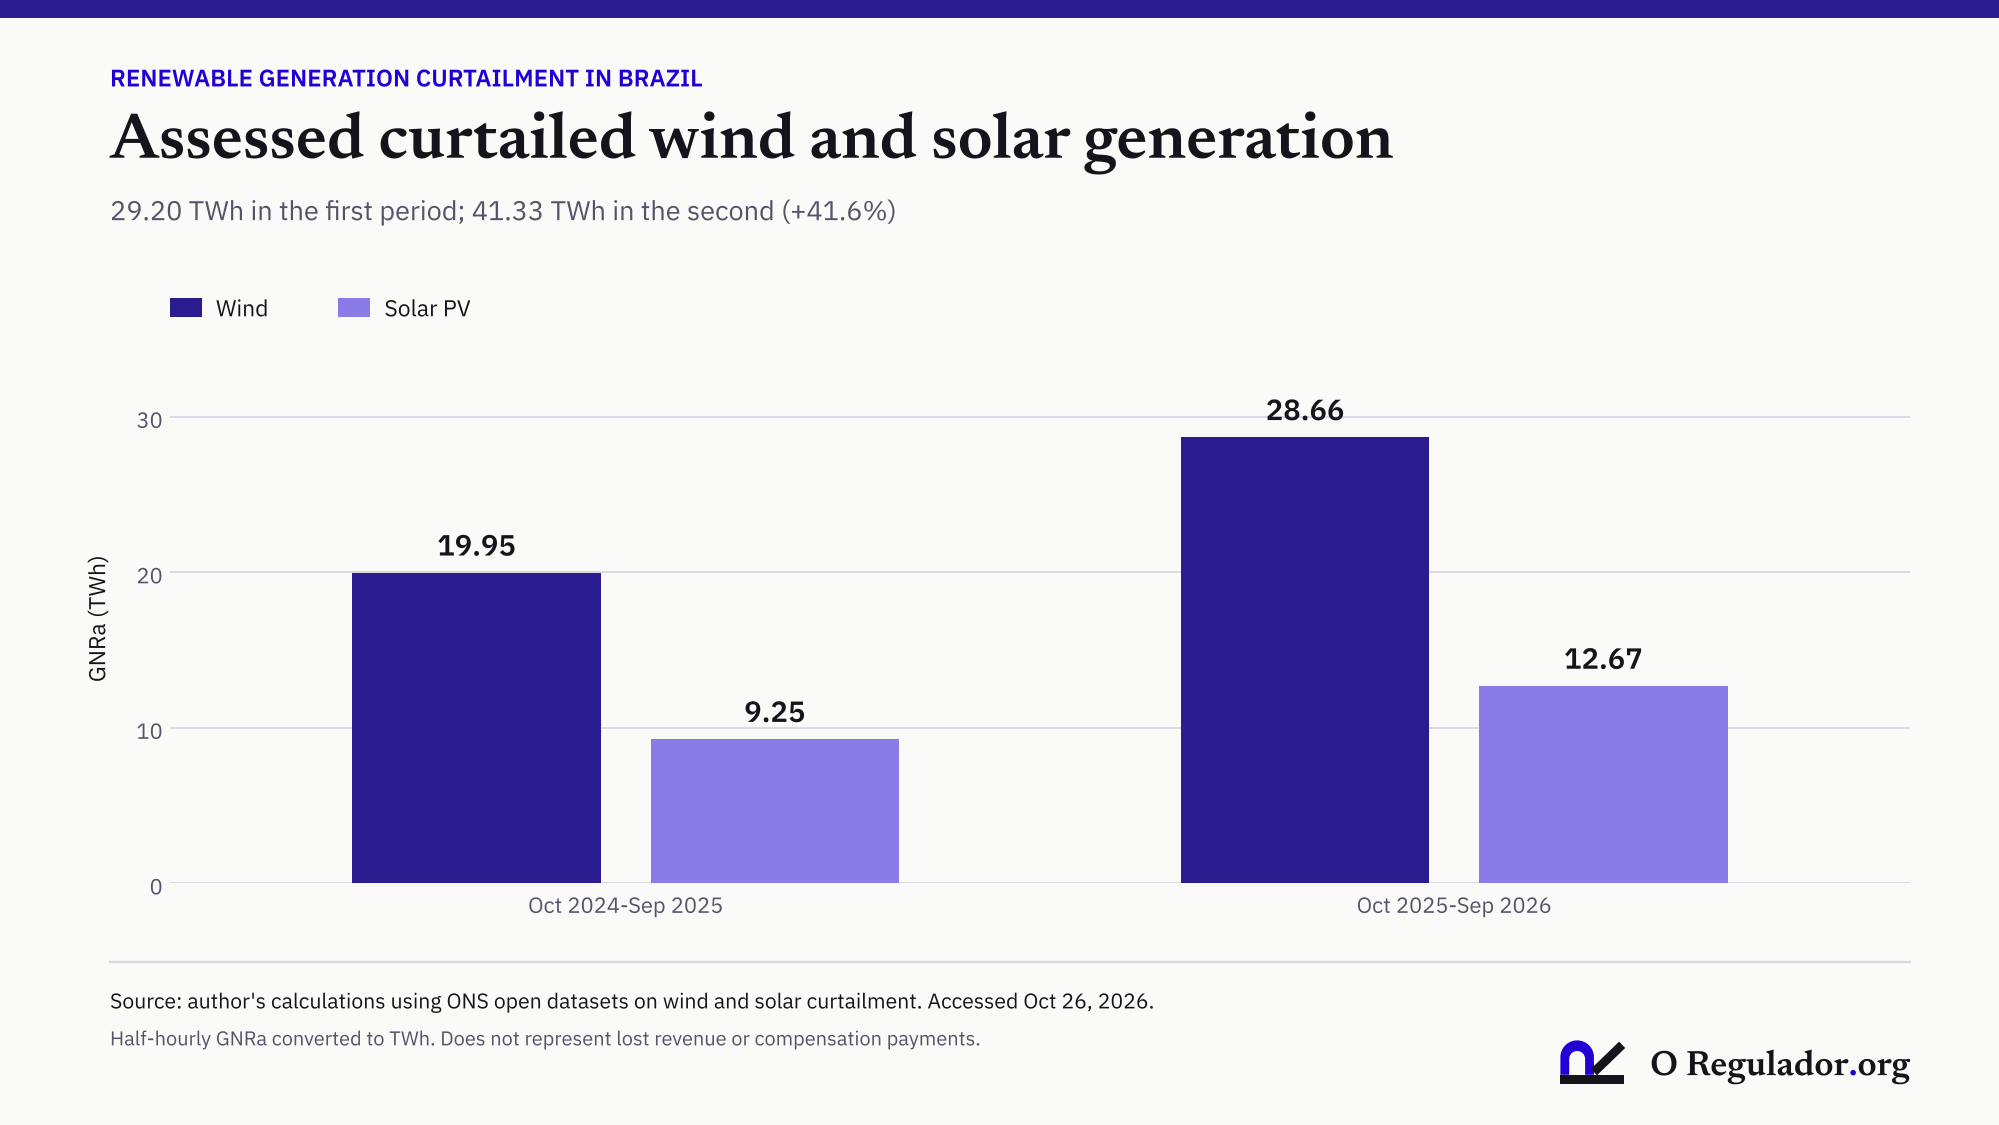
The absolute increase is significant, but it must be interpreted carefully. The number of plants covered changes, as do wind conditions, sunlight, and system operating conditions. To address one of these limitations, we also tested a panel of plant identifiers present in both periods, with high temporal coverage. In that group, GNRa as a share of GNRa plus actual generation also rose, although the test does not control for every other variable. This is a research indicator, not an official system-wide curtailment rate for the SIN. [3][4]
The Most Important Change Is in the Reasons for Curtailment
ONS classifies curtailment under three main reasons: external facility unavailability (REL), involving unavailable facilities outside the power plant; electrical reliability constraints (CNF), when safe system operation requires certain limits to be respected; and energy-related curtailment (ENE), when the available generation cannot all be accommodated by demand. [3][4][5]
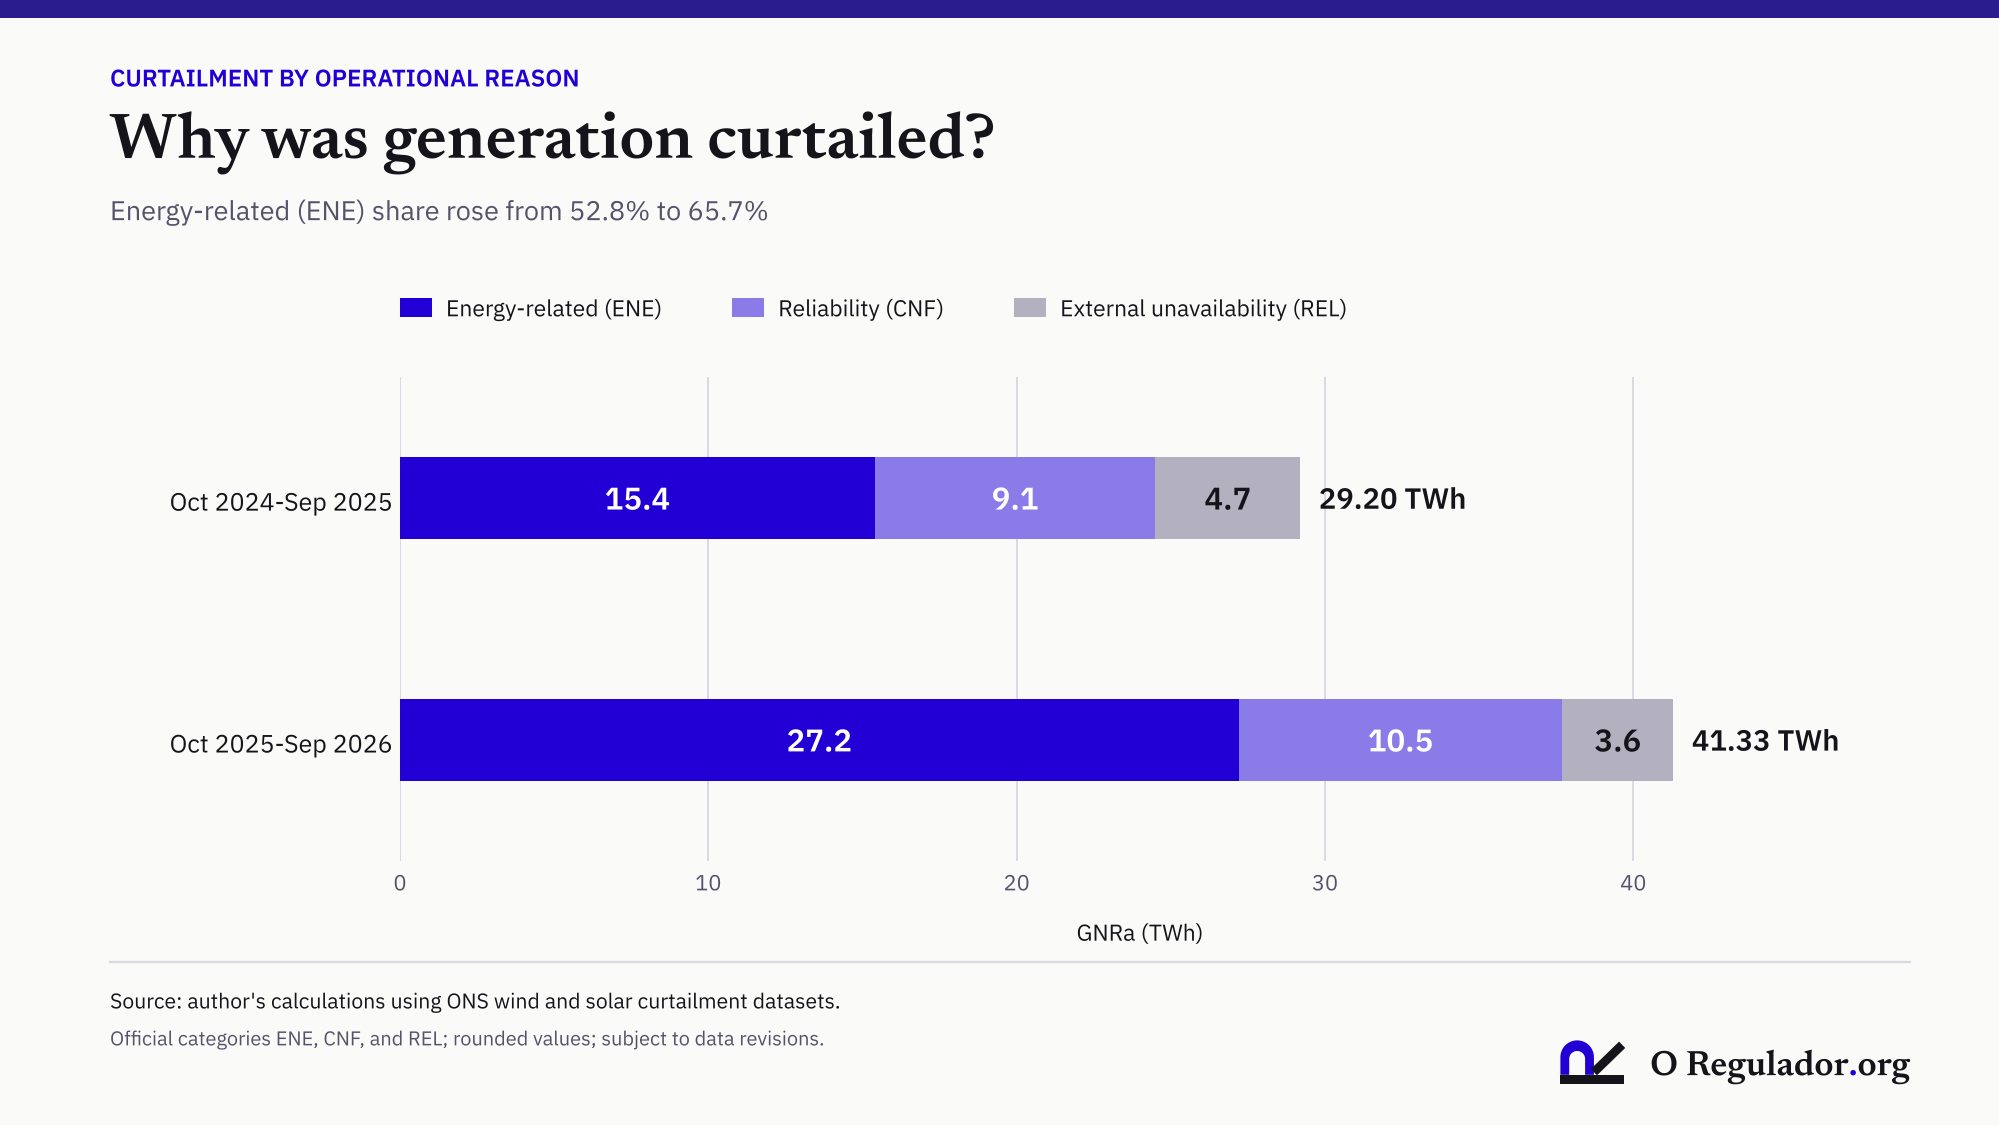
ENE’s share increased from approximately 52.8% to 65.7% of the volume examined. In the most recent period, 80.8% of energy-related GNRa occurred between 9:00 a.m. and 3:59 p.m., and Sundays accounted for approximately 28.2% of its annual total. In the Northeast, average daily electricity demand was lower on Sundays than on weekdays, while average daily energy-related curtailment was higher. [3][4]
The same Sunday, October 18, shows this pattern hour by hour. That day, ONS recorded 173.2 GWh of GNRa for energy-related reasons, 16.7 GWh for external unavailability, and 0.6 GWh for reliability. Energy-related curtailment was concentrated between 7:00 a.m. and 3:00 p.m., when residual load was at its lowest. [3][4]
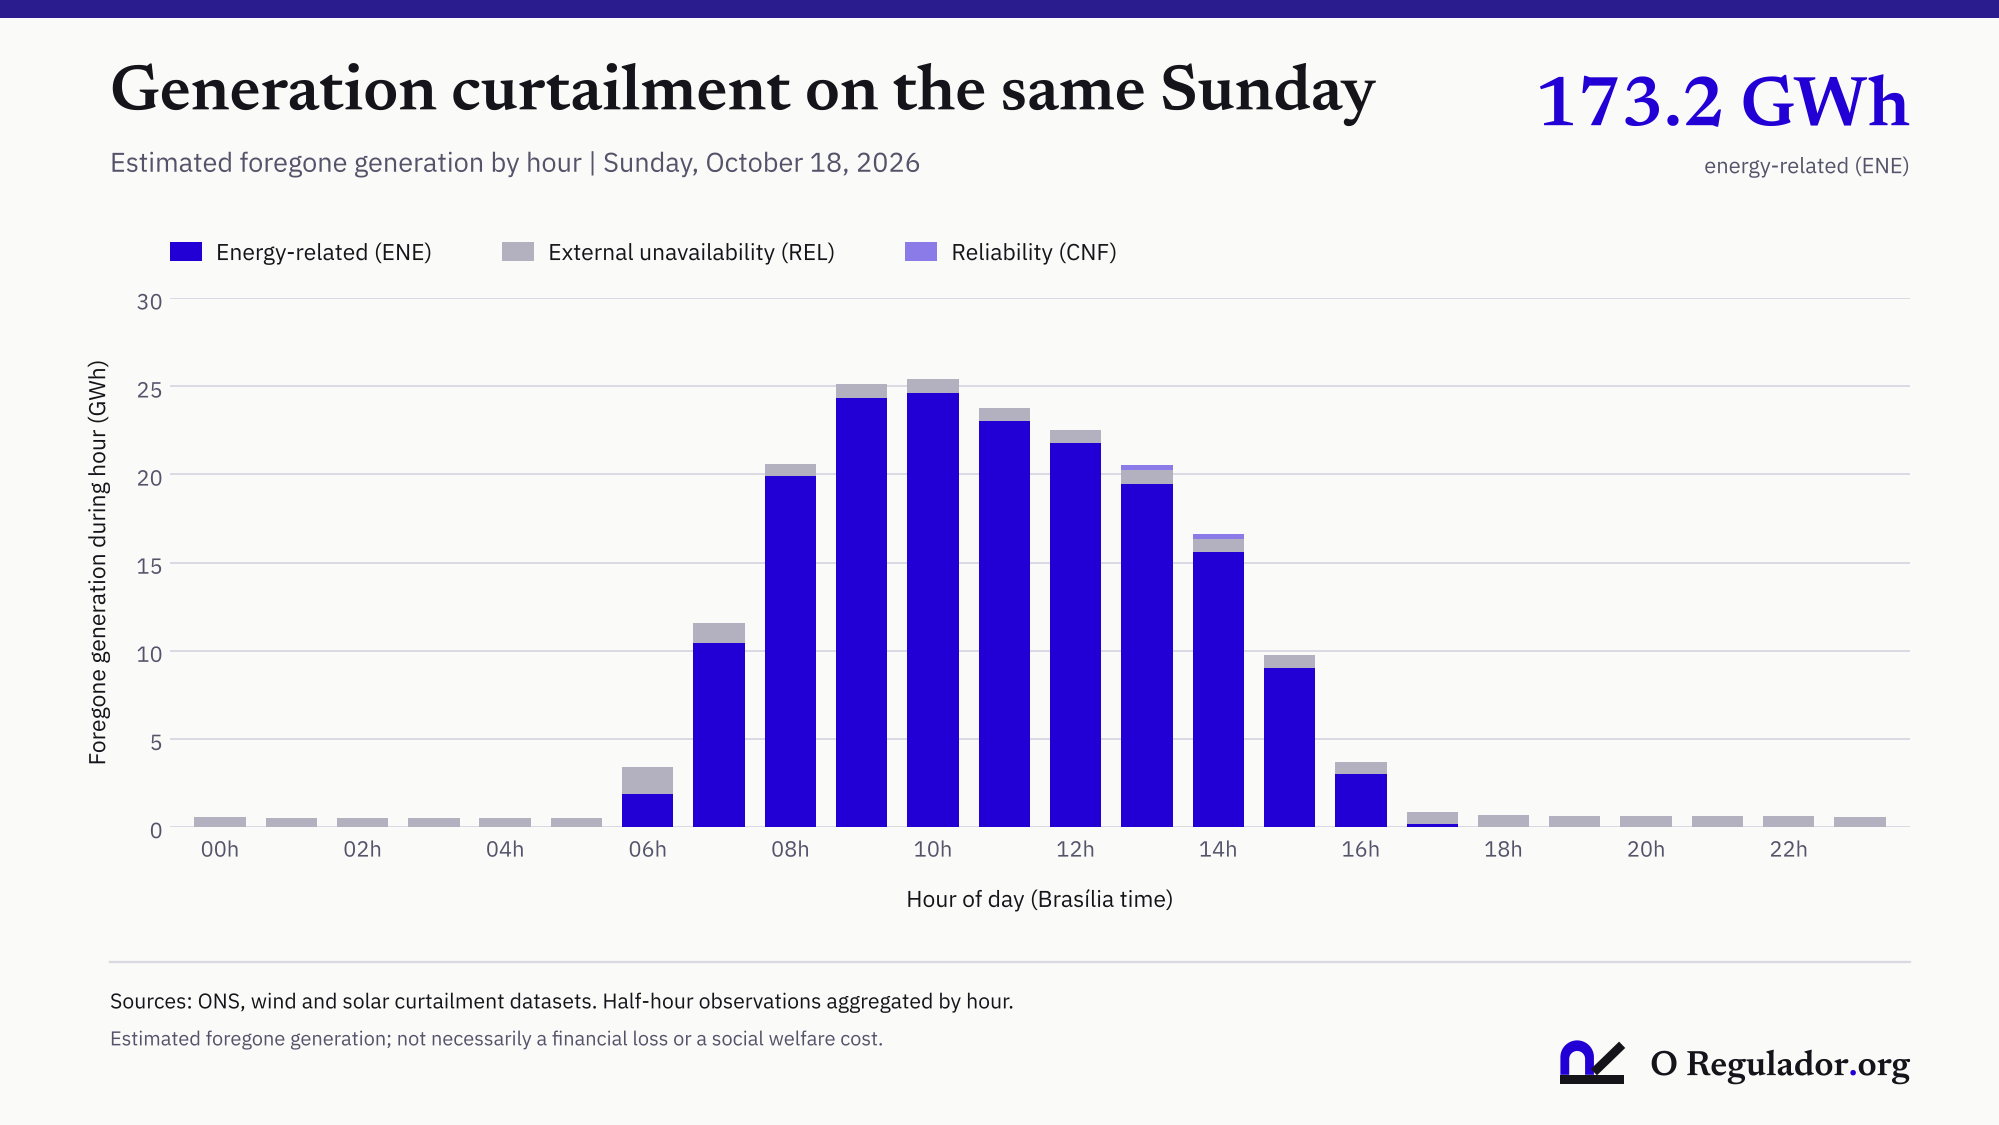
This pattern is consistent with a mismatch between generation availability and the timing of demand. It does not establish that a specific share of curtailment was caused by MMGD or by the absence of a particular transmission line. A causal finding would require counterfactual simulations of generation, load, transmission, and system operations.
Managing Curtailment Is Not the Same as Addressing Its Causes
The debate often combines three problems that should be examined separately.
The first is operational: when a constraint cannot be avoided at that moment, which plants should reduce output to preserve system security and meet operating requirements? The second is commercial: how should the economic consequences of those reductions be allocated among eligible participants? The third is structural: which planning, investment, and consumption decisions could reduce future curtailment at a justifiable cost?
ANEEL Technical Note No. 240/2024-SGM/ANEEL, prepared in connection with Public Consultation No. 45/2019, explicitly recognizes this distinction in scope. Its analysis focused on how to organize necessary curtailments, while also identifying broader proposals involving transmission expansion, energy storage, demand response, changes to inflexible generation requirements, and improved market signals. [5]
The document also demonstrates that industry positions cannot be reduced to a simple dispute between generators and consumers. Brazil’s Electric Power Trading Chamber (CCEE) advocated considering opportunity costs for the system, not just charges passed through to consumers. The energy consultancy PSR argued that physical operations should follow optimization criteria and examined competitive mechanisms for revealing costs. ANEEL’s technical staff studied a mechanism based on bids submitted after the operating period, but did not recommend that particular design, partly because of unequal opportunities for consumer participation and the implications of hydrological risks transferred to consumers. [5]
ANEEL Normative Resolution No. 1,170/2026, approved subsequently, must be distinguished from those 2024 proposals. The adopted framework provides for phased implementation, a period in which impacts are simulated, and transparency procedures. None of this supports attributing curtailment recorded before October 2026 to the new rule. [1]
This case illustrates a classic issue in the economics of regulation: the rule that determines efficient physical dispatch is not necessarily the same rule that produces the most appropriate commercial allocation of risk. And improving the allocation of commercial consequences does not, by itself, eliminate the physical constraint.
Can Curtailment Be Economically Efficient?
Yes. Although reducing output from generators with low variable costs may seem counterintuitive, eliminating every instance of curtailment would require transmission, storage, and flexibility resources sized even for infrequent conditions. Building, operating, and maintaining those resources imposes costs.
Consider a new transmission line that would allow some currently curtailed electricity to be delivered. If the line’s social cost exceeds the social value of the additional electricity actually used and its other benefits, building it solely to eliminate curtailment may not be the most efficient choice.
This does not mean that current curtailment levels are optimal. It means the appropriate economic objective is not necessarily zero curtailment, but a lower total social cost, established through the comparison of feasible alternatives.
How Can We Turn This into a Verifiable Economic Assessment?
Social cost-benefit analysis provides a familiar framework: add up the incremental benefits an intervention would generate, subtract its incremental costs, and express amounts from different years on a common present-value basis. The monetized result is net present social value (NPSV). This is the methodological principle used, among other sources, in the United Kingdom’s 2026 Green Book. [6]
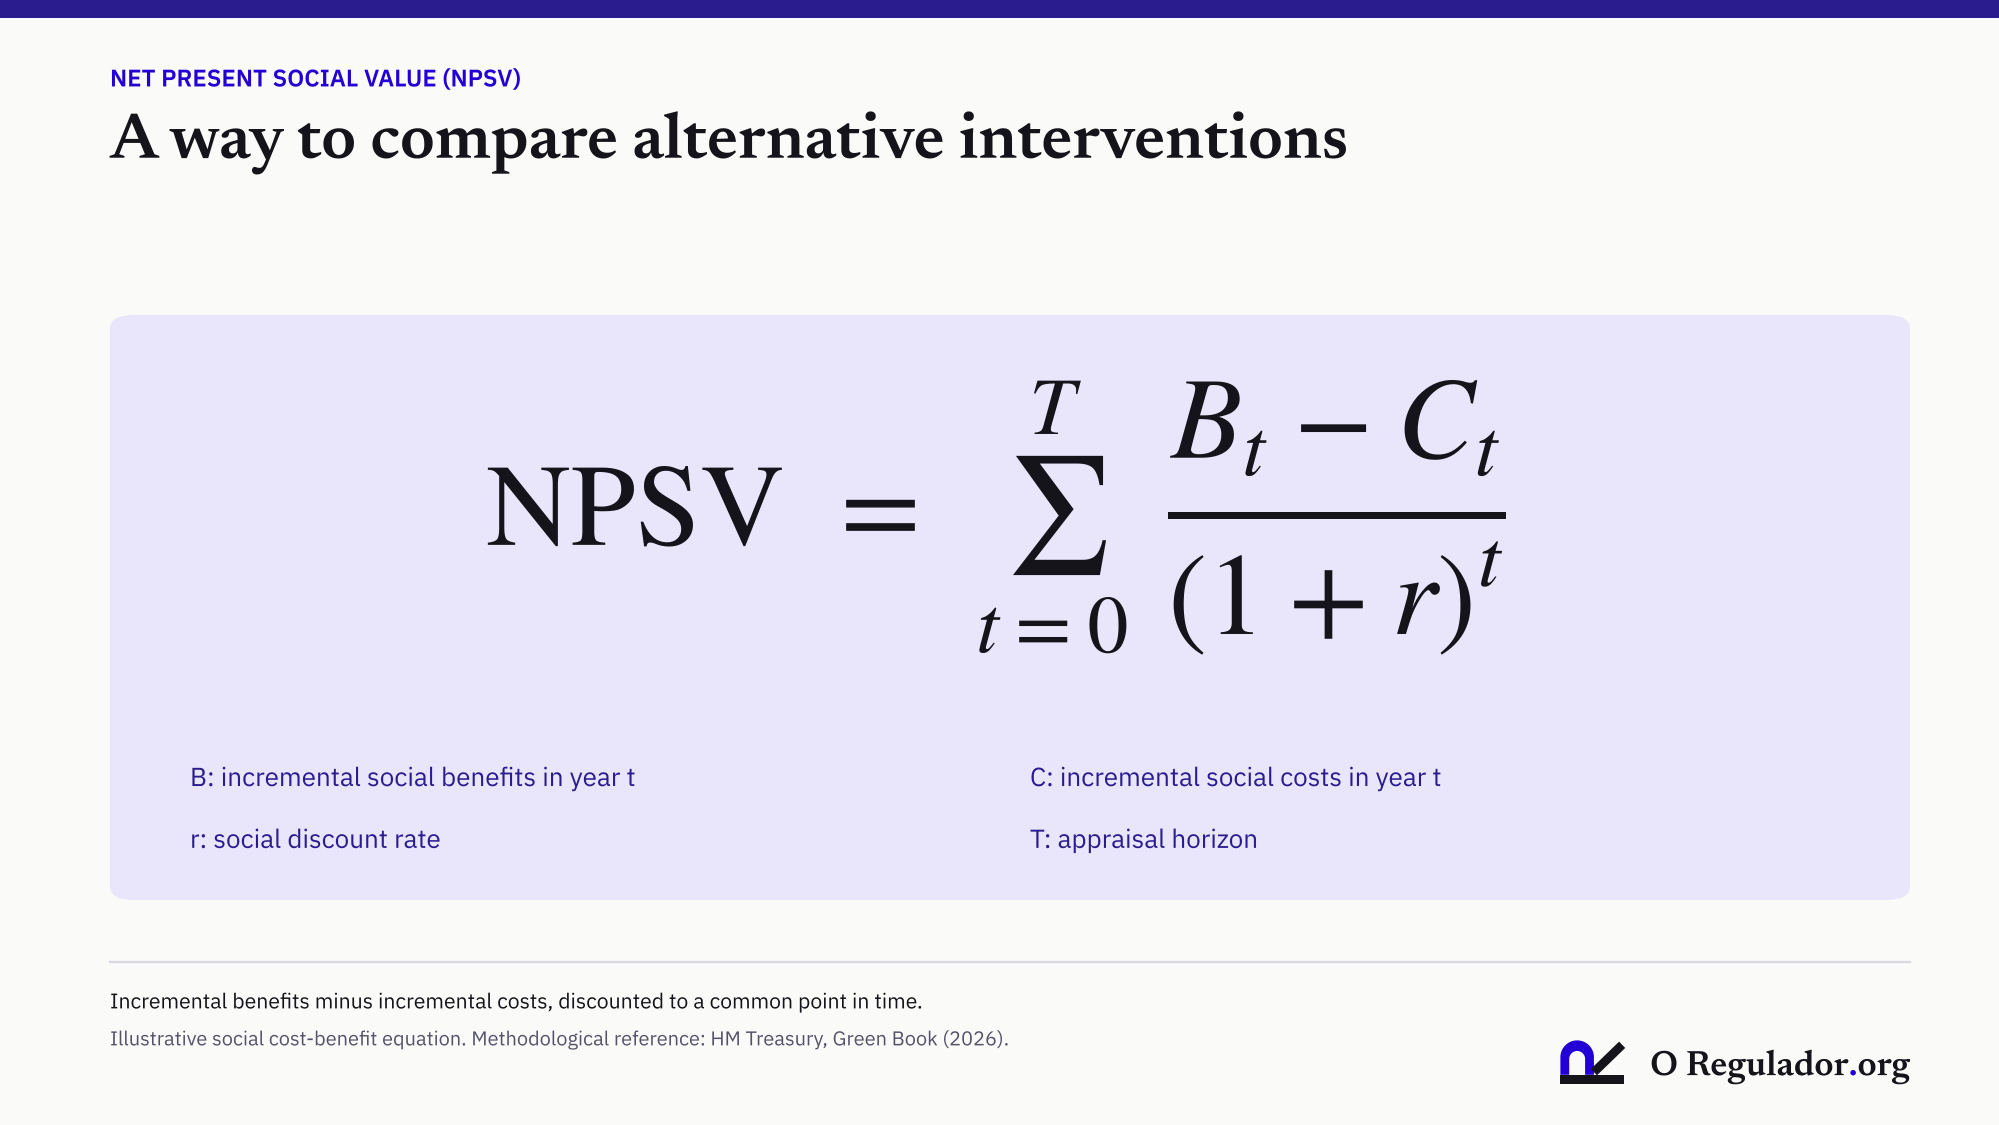
In plain language, recovering more electricity is worthwhile when the additional benefits to society justify the cost of doing so. Every option must be assessed against the same baseline, and the assessment must also consider impacts that cannot be reliably expressed in monetary terms.
A purely illustrative example makes the idea easier to understand. Suppose an intervention costs R$12 million today and produces R$10 million in incremental social benefits in each of the next two years, with no other expenses. At a hypothetical discount rate of 10% per year, the benefits would be worth approximately R$17.36 million today. After subtracting the investment, NPSV would be approximately R$5.36 million. Under these simplified assumptions, the intervention would have a positive result. The 10% discount rate is not a recommendation for Brazilian regulatory appraisals.
In practice, maintenance costs, risks, distributional differences, and nonmonetizable benefits would also need to be considered. Nor can one simply multiply curtailed MWh by Brazil’s Differences Settlement Price (PLD) and call the product a social loss. Market price, foregone contract revenue, a charge actually paid, and the economic cost to society are different quantities.
Average Exposure Versus Marginal Cost
A private investment decision may affect other market participants. A wind plant built in an area with good wind resources but constrained transmission may reduce the amount of electricity that already-connected plants can deliver. This creates a potential network externality: part of the decision’s cost is not fully reflected in the investor’s own calculations.
David Newbery and Darryl Biggar examine this issue in a 2024 study of marginal renewable energy curtailment, access regimes, and electricity pricing. Their models show that the effect of adding one more unit of capacity can differ substantially from the average curtailment rate experienced by existing generators. This is why access rules and locational signals matter for efficient expansion. The study’s numerical findings cannot simply be applied to Brazil without further analysis. [7]
The regulatory question is therefore practical: are grid access conditions and economic signals leading new investments to account for the additional costs they may impose on the system? The answer depends on market design, information quality, and mechanisms compatible with Brazil’s institutions.
Who Should Bear the Risks?
There are legitimate arguments on different sides. For generators, unpredictable restrictions can undermine revenues, affect contracts, and raise the cost of capital. For consumers and other participants, broad compensation mechanisms may create additional charges and weaken incentives for new projects to account for foreseeable siting and expansion risks.
Laffont and Tirole show how information asymmetry and moral hazard shape the incentives offered to regulated firms. They also discuss how risk aversion and the absence of credible regulatory commitments can affect contracts and investment decisions. [8] Applied to curtailment, these foundations suggest that both indiscriminate protections and excessive risk transfers can distort future choices. This application to the Brazilian power sector is an interpretation of this article, not a specific conclusion by the authors about generation curtailment.
This is not an argument for unrestricted compensation or for assigning all risks to project developers. It is essential to distinguish foreseeable, priceable risks from subsequent rule changes or legitimately established commitments. A risk that a generator cannot control may nonetheless be known and capable of being priced. Conversely, a mechanism designed to protect past investments may need different signals to guide future ones.
CCEE’s public documentation helps separate these dimensions. Its open-data portal provides prices and recorded charge components, including items related to constrained-off generation. However, a recorded charge does not, on its own, reveal a generator’s net loss or every term of its bilateral contracts. This is why the 41.33 TWh observed in ONS records have not been converted in this article into a monetary estimate of compensation. [9]
The same distinction applies to the compensation framework established in federal legislation and implemented by Brazil’s Ministry of Mines and Energy (MME) in 2026 for certain historical events. The publication of a list of eligible power plants does not, by itself, establish that payments were made or that compensation equals all unrealized generation. [10]
Which Combination of Tools Could Work?
There is no single solution. Transmission can alleviate physical bottlenecks. Energy storage can shift some available electricity to hours when it is more valuable. Demand response can encourage electricity use when supply is abundant. Better forecasting and greater operational flexibility can reduce some curtailment needs. Locational signals and coordinated planning can make new investments less likely to aggravate known constraints. [5][6][7]
But these tools are not perfect substitutes. A line that helps relieve regional congestion may not solve a system-wide energy surplus during low-demand hours. A battery can help, provided its duration, location, and compensation justify its cost. An incentive to increase electricity consumption must also deliver genuine benefits, rather than merely shifting charges to other users.
Regulatory design must also consider the institutional capacity to implement a solution: data quality, transparency, enforcement costs, the transition of existing contracts, and the ability to evaluate outcomes after implementation.
What I Consider Essential for the Next Stage
My assessment is that the most important regulatory problem is not to choose, in general terms, who should pay for every instance of curtailment. It is to develop rules that preserve system security, honor legitimate commitments, and ensure that new investment decisions account for the costs they impose on the system.
Without that final element, we may resolve part of the financial allocation of today’s curtailments while continuing to create the economic conditions for future ones. Without legal predictability, on the other hand, we may also make the investments needed for the energy transition more expensive.
Sound regulation needs to address both consequences at once. Above all, it needs to measure what actually changes afterward: lower social costs, better incentives, and more efficient use of resources, not merely a new way of distributing losses among market participants.
Methodological Note
The duck-curve figure uses 24 hourly observations from the ONS energy balance for October 18, 2026, cross-checked against the separate Hourly Load Curve dataset. For each hour, hydropower, thermal, wind, and solar generation sum to SIN load, subject to rounding. Residual load is defined for this figure as total load minus wind and solar generation. The energy balance includes MMGD estimates; the curve does not measure potential generation or GNRa. [2]
The annual results are based on queries of the ONS wind and solar curtailment datasets, carried out on October 26, 2026, covering approximately 7,858,656 records over 730 days. GNRa, recorded as average MW, was converted into MWh using 0.5-hour intervals. We checked timestamp coverage, plant-and-time keys, the absence of negative GNRa values, and records without a classified curtailment reason. Twenty-eight solar records showing positive GNRa with no identified reason, equivalent to about 0.001 TWh, were retained in the overall total but not assigned to ENE, CNF, or REL. The October 18, 2026 curtailment figures (Figure 4) come from the same datasets, with half-hour GNRa summed by hour and by reason. ONS may revise the underlying datasets. No causal impacts, net contractual losses, or actual monetary social costs were estimated. [3][4]
Editorial Independence
Although I work at ANEEL, I did not take part in the agency’s internal technical review or institutional decision-making process concerning the regulation discussed in this article. This analysis relies exclusively on public data and documents. The interpretations and opinions expressed here are my own, do not represent ANEEL’s institutional positions, and are not intended to influence ongoing regulatory proceedings.
References
- ANEEL. ANEEL aprova regra para organizar cortes de geração [ANEEL approves rules for managing generation curtailment]. October 6, 2026. News item on Normative Resolution No. 1,170/2026 and Public Consultation No. 45/2019. Available at: https://www.gov.br/aneel/pt-br/assuntos/noticias/2026/aneel-aprova-regra-para-organizar-cortes-de-geracao. Accessed October 27, 2026.
- ONS. Balanço de Energia nos Subsistemas [Energy Balance by Subsystem] and Curva de Carga Horária [Hourly Load Curve]. Open Data Portal. SIN data for October 18, 2026, retrieved and cross-checked on October 27, 2026. Residual load was calculated for the figure as total load minus wind and solar generation. Available at: https://dados.ons.org.br/dataset/balanco-energia-subsistema and https://dados.ons.org.br/dataset/curva-carga. Accessed October 27, 2026.
- ONS. Dados de Restrição de Operação por Constrained-off de Usinas Eólicas [Constrained-off operation restriction data for wind plants]. Open Data Portal, half-hourly dataset. Accessed October 26, 2026: https://dados.ons.org.br/dataset/restricao_coff_eolica_usi
- ONS. Dados de Restrição de Operação por Constrained-off de Usinas Fotovoltaicas [Constrained-off operation restriction data for solar PV plants] and Carga de Energia Diária [Daily Energy Load]. Open Data Portal. Accessed October 26, 2026: https://dados.ons.org.br/dataset/restricao_coff_fotovoltaica and https://dados.ons.org.br/dataset/carga-energia
- ANEEL. Technical Note No. 240/2024-SGM/ANEEL, November 12, 2024, administrative proceeding No. 48500.000375/2019-83, Public Consultation No. 45/2019. In particular, pp. 16, 24 to 46, and 62 and 63. Original Portuguese document available at: https://antigo.aneel.gov.br/web/guest/consultas-publicas?p_p_id=participacaopublica_WAR_participacaopublicaportlet&p_p_lifecycle=2&p_p_state=normal&p_p_mode=view&p_p_cacheability=cacheLevelPage&p_p_col_id=column-2&p_p_col_pos=1&p_p_col_count=2&_participacaopublica_WAR_participacaopublicaportlet_ideDocumento=54211&_participacaopublica_WAR_participacaopublicaportlet_tipoFaseReuniao=fase&_participacaopublica_WAR_participacaopublicaportlet_jspPage=%2Fhtml%2Fpp%2Fvisualizar.jsp. Accessed October 28, 2026.
- HM Treasury. The Green Book (2026): Central Government Guidance on Appraisal and Evaluation. Sections on social cost-benefit analysis, discounting, and net present social value. Available at: https://www.gov.uk/government/publications/the-green-book–2/the-green-book-2026. Accessed October 27, 2026.
- NEWBERY, David M.; BIGGAR, Darryl R. Marginal curtailment of wind and solar PV: Transmission constraints, pricing and access regimes for efficient investment. Energy Policy, vol. 191, article 114206, 2024. DOI: https://doi.org/10.1016/j.enpol.2024.114206
- LAFFONT, Jean-Jacques; TIROLE, Jean. A Theory of Incentives in Procurement and Regulation. Cambridge, MA: MIT Press, 1993. See especially the Introduction, section 1.1, pp. 1-2 (information asymmetry and moral hazard); the Introduction, section 4.2, pp. 39-40 (incentives and rent extraction); chapter 1, section 1.9, pp. 99-102 (investment and regulatory commitment); and chapter 1, section 1.11, pp. 105-106 (risk aversion). Available at: https://mitpress.mit.edu/9780262121743/a-theory-of-incentives-in-procurement-and-regulation/. Accessed October 27, 2026.
- CCEE. Open Data Portal, including datasets
ENCARGO_ESS_ANCILAR,ENCARGO_HORARIO_SUBMERCADO, andPLD_HORARIO. https://dadosabertos.ccee.org.br/ - MME. MME avança na compensação por cortes de geração com divulgação de lista de elegibilidade [MME advances generation curtailment compensation by publishing an eligibility list]. October 5, 2026; MME Normative Ordinance No. 140/2026. Available at: https://www.gov.br/mme/pt-br/assuntos/noticias/mme-avanca-na-compensacao-por-cortes-de-geracao-com-divulgacao-de-lista-de-elegibilidade
The opinions and analyses expressed in this article are personal and do not represent the institutional positions, decisions, or interpretations of the Brazilian Electricity Regulatory Agency (ANEEL).
How to cite this article
ALCÂNTARA, Márcio. Curtailment in Brazil: Who Pays for the Energy the Grid Leaves Unused?. Regulador.org, 2026. Available at: https://www.regulador.org/en/2026/10/29/curtailment-who-pays/. Accessed on: Oct. 30, 2026.
Dr. Márcio Alcântara
Electrical engineer with a master's degree and a PhD from UNICAMP. A civil servant at ANEEL since 2008. Writes about regulation as a discipline: how public decisions are built, what evidence supports them, and how they can be more transparent.