Who Should Pay for the Capacity the Power System Needs?
Brazil's power system needs firm capacity. The article separates legal from economic incidence and shows, with ONS data, why the cost should follow its cause.
At noon, Brazil can have so much solar and wind generation available that some plants have to cut their output. A few hours later the problem flips: generation from other sources has to ramp up fast, or demand has to fall, to keep supply and demand in balance. On the same day, the system lives with surplus energy at one hour and a shortage of capacity and flexibility at another.
This is the backdrop for the debate over batteries that gained force in 2026. Brazil procured about 19 GW of capacity in its March auction and, in October, approved the tender documents for two auctions dedicated to energy storage. At the same time, there is a dispute over who should pay for those contracts. [1][2]
The question of who pays is legitimate, but there is an earlier one: how much additional capacity will really be needed, at what hours and locations, and which combination of resources can supply it at the lowest cost to society? Without that answer, we risk fighting over how to split a bill without having shown how the bill was calculated.
Abundant energy does not eliminate the need for capacity
In the previous article, Curtailment in Brazil: Who Pays for the Energy the Grid Leaves Unused?, I showed the shape of the so-called duck curve. Solar generation reduces, during the day, how much we need from other sources. When the sun goes down, that need grows again, sometimes sharply.
Sunday, October 18, 2026, is an example. According to hourly data from the National Electric System Operator (Operador Nacional do Sistema Elétrico, ONS), residual load on the National Interconnected System (Sistema Interligado Nacional, SIN), which here means total load minus wind and solar generation, was about 31.3 GW at noon and reached 77.0 GW at 7 p.m. That is 45.7 GW more in seven hours. [3]
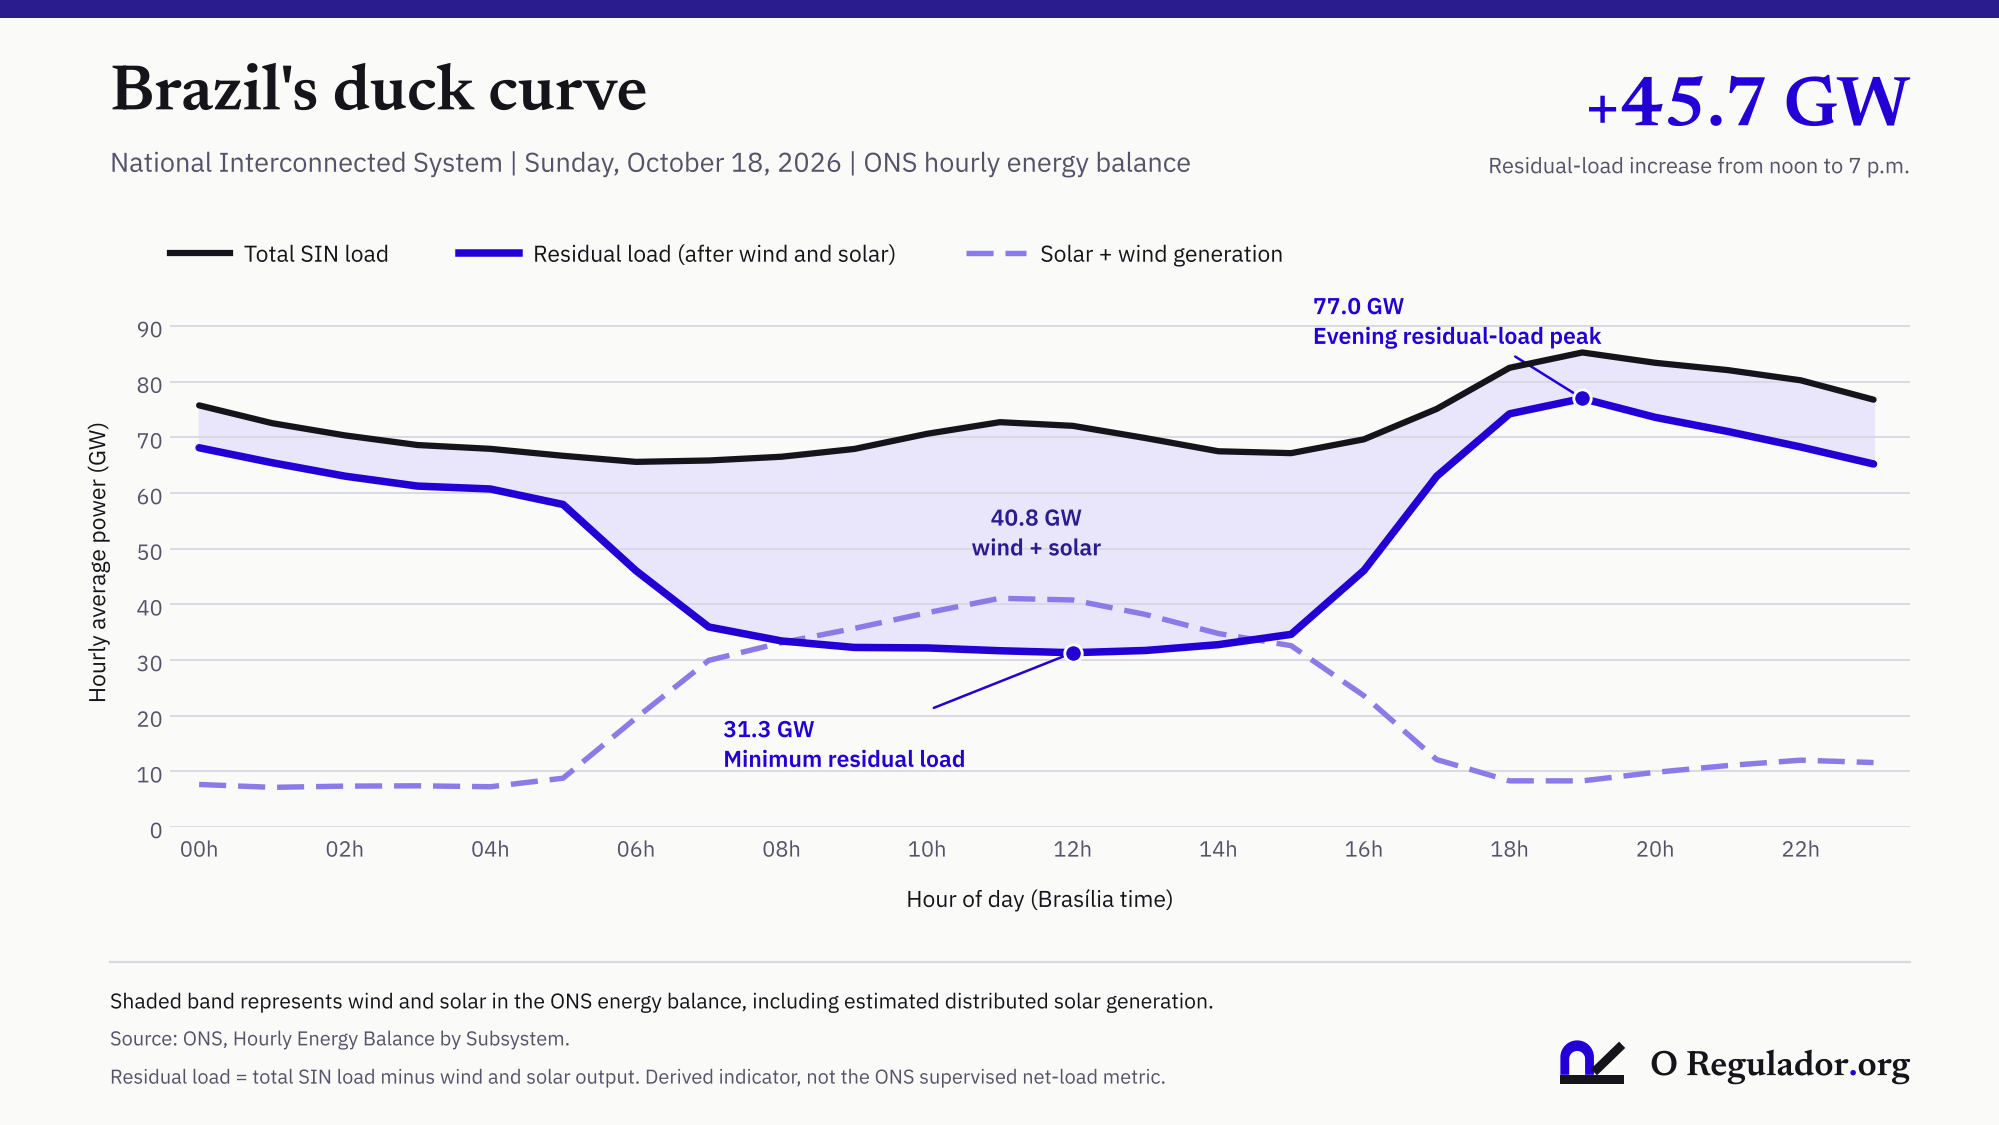
A single Sunday could be an exception. The analysis was therefore extended to all 31 days of October 2026, with a comparison against the same month in 2025. For each day, the wind and solar generation reported by the ONS was subtracted from total SIN load, and the difference between the 7 p.m. hour and the noon hour was calculated. [3]
In October 2026, residual load at 7 p.m. was on average 38.39 GW higher than at noon. In October 2025, the average difference had been 30.28 GW. In 2026 it was positive on all 31 days, ranging from 27.44 to 50.12 GW. October 18 is part of a broader pattern, then: from midday to early evening, the system depends far more on other sources. [3]
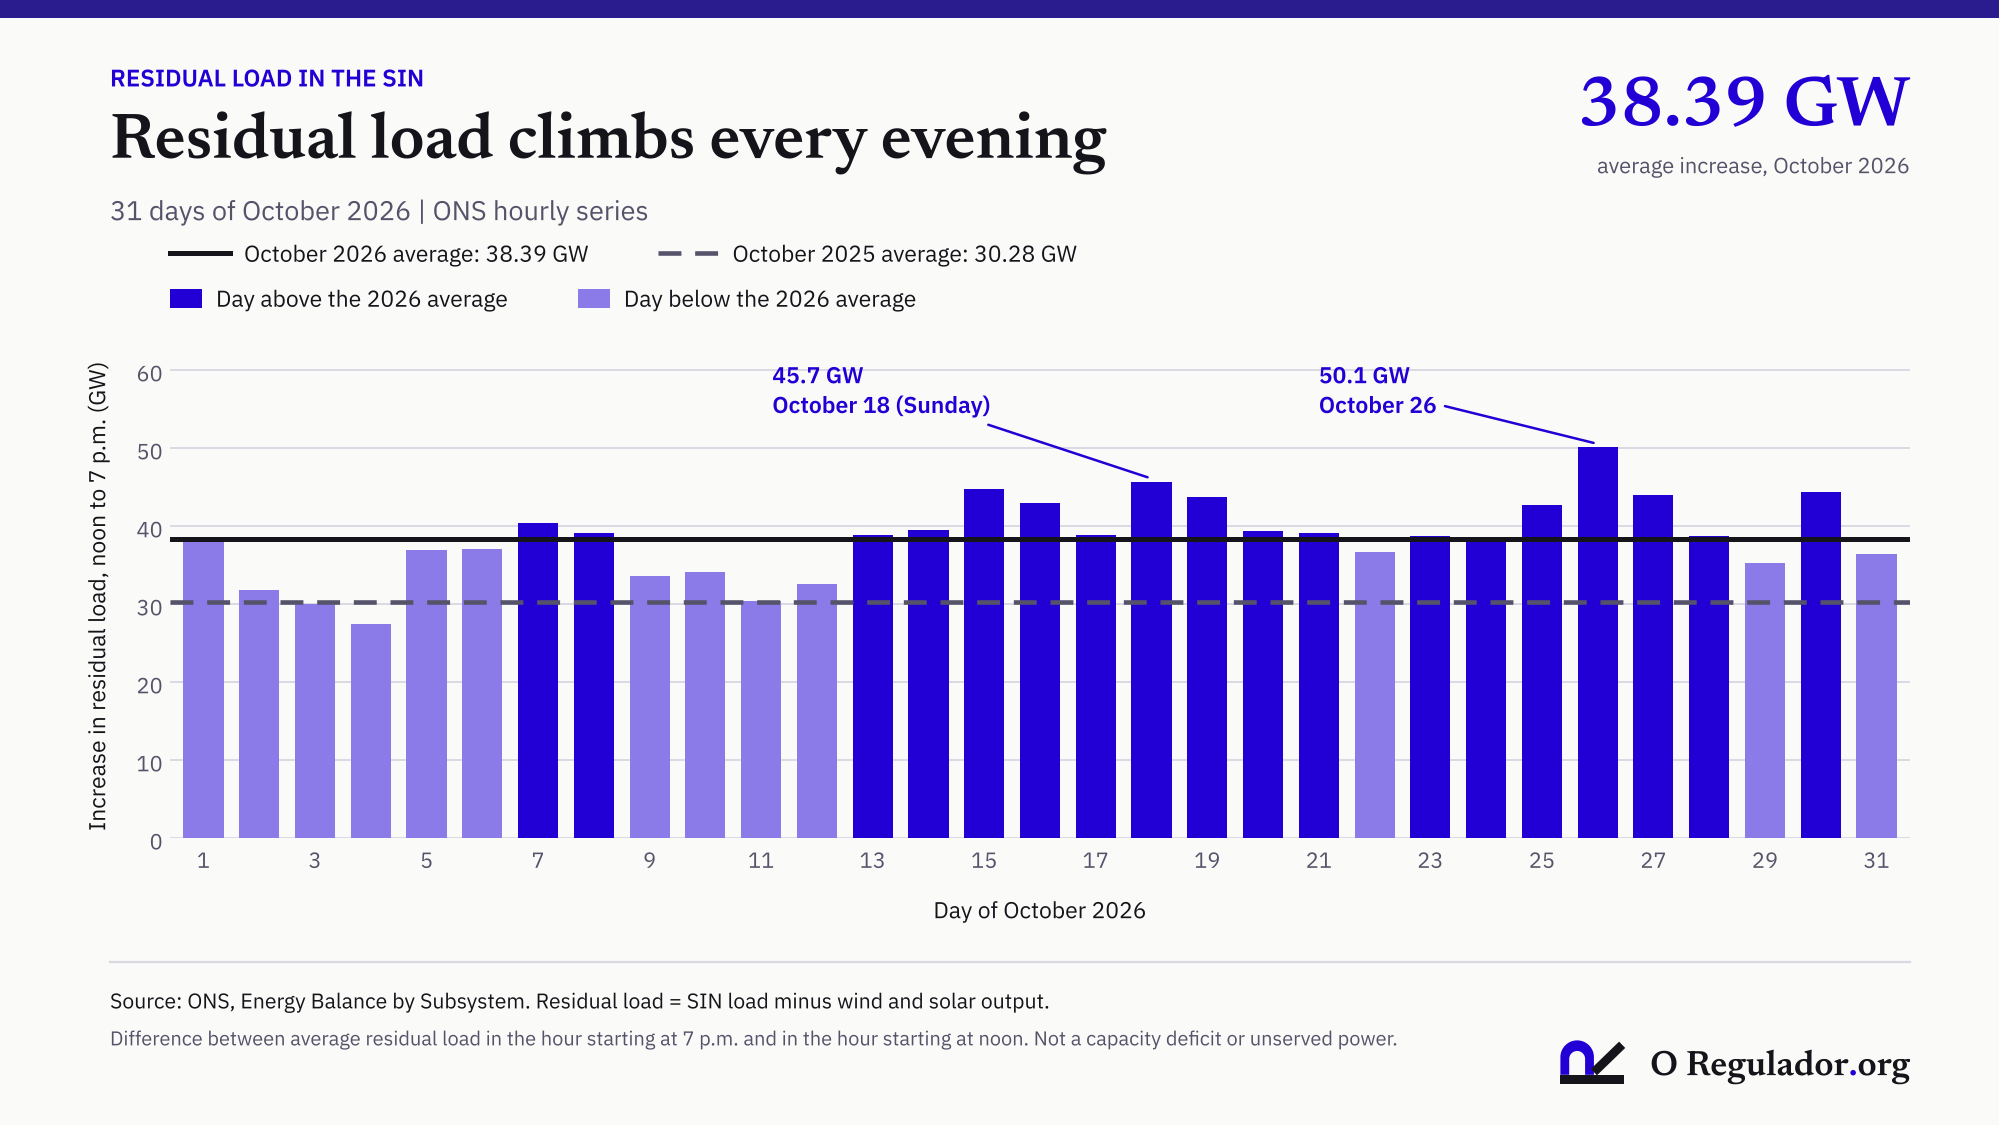
These numbers call for careful reading. The 38.39 GW is not an estimate of a capacity deficit, nor a recommendation to procure 38.39 GW of batteries. Part of that difference can be met by existing hydropower plants, thermal plants, power transfers between regions, and other sources. How much is truly missing depends on the capacity available, future demand, and the risk of failure the system is willing to accept.
The makeup of the two hours also changed. In October 2026, average SIN load at noon was 87.82 GW, and wind and solar generation totaled 48.62 GW. At 7 p.m., average load rose to 93.78 GW, but wind and solar dropped to 16.19 GW. These are measurements of observed operation. They do not simulate how much capacity would be missing if a group of power plants did not exist. [3]
Energy, capacity, and flexibility are not the same thing
The difference between energy and power is familiar to electrical engineers, but the economic consequences do not always show up clearly in contracts.
Energy, measured in megawatt-hours (MWh), says how much was produced or consumed over a period. Power, measured in megawatts (MW), is the ability to produce or consume at a given moment. Resource adequacy asks whether the full portfolio of resources can meet demand, including under bad conditions. And flexibility is the ability to change production or consumption quickly when conditions vary or turn out differently than expected.
A 1,000 MW battery with four hours of duration has, on paper, 4,000 MWh for one full discharge cycle. But that output cannot be sustained indefinitely: the energy stored at the time, the duration required, losses, availability, and the chance to recharge all matter. A 1,000 MW solar plant can generate a lot of energy over the year and help very little with an evening peak. A reservoir hydropower plant can shift output across time, but it depends on water, turbines, operating limits, and access to the grid.
That is why annual capacity factor is not the same as dependable contribution to reliability. Probabilistic methods such as Effective Load Carrying Capability (ELCC) try to estimate how much a resource contributes to meeting demand under the highest-risk conditions, given the makeup of the system. That value is not a fixed property of each technology. The method is discussed, for example, in the report of a technical workshop held by the North American Electric Reliability Corporation (NERC), published in September 2025, which does not mean it should be adopted in Brazil as is. [4]
Brazil already has security-of-supply criteria that look at energy and capacity through risk metrics, such as Loss of Load Probability (LOLP) and measures of unserved energy and unserved power. The debate does not start from scratch. The challenge is to turn those needs into coherent products and incentives. [5]
A study by Renato Haddad Simões Machado and Erik Eduardo Rego, published in Energy Policy in March 2026, helps organize the problem. The authors propose treating the energy-adequacy and capacity-adequacy dimensions together, so that the design of mechanisms does not favor a technology before its contribution to reliability has been shown. Brazil appears as a relevant case. That is the study’s central proposal as described in its abstract, and it does not, by itself, supply a number of batteries the SIN should procure today. [6]
Another 2026 study, by Laís Domingues Leonel and coauthors, adds flexibility adequacy. A system can have megawatts to spare for the peak and still struggle to ramp production up or down at the speed required while respecting operating constraints. [7]
What are the 2026 auctions actually buying?
The auctions should not be confused. The March auction, which procured about 19 GW, and the storage auctions scheduled for December are separate procedures, each with its own products and conditions. [1][2]
On October 27, 2026, the Brazilian Electricity Regulatory Agency (Agência Nacional de Energia Elétrica, ANEEL) approved Auction Notices No. 05/2026 and No. 06/2026, with auctions scheduled for December 2 and 4, 2026. Both cover the procurement of available capacity from new battery storage systems, with delivery starting August 1, 2028, under 15-year contracts. One notice includes domestic-content requirements and the other does not. [2]
The technical commitment calls for full-power availability for four hours per cycle, with up to two cycles per day and an annual limit of 366 cycles, plus a full recharge within six hours. Payment is a fixed annual revenue, with performance adjustments. [2]
These terms describe the product being procured. They do not show that every possible benefit of a battery, such as energy arbitrage, reduced curtailment, frequency control, or congestion relief, will be delivered at each location or paid for separately. Technical capability, contractual obligation, and actual benefit to the system have to be kept apart.
On October 19, the Energy Research Office (Empresa de Pesquisa Energética, EPE) published the methodology for the Reference Marginal Cost (Custo Marginal de Referência, CMR) of the storage auctions, with assumptions about investment, operation, financing, and differences between products. The CMR helps set the price cap. It is not the final contract price, which depends on competition, and it does not automatically equal the social benefit of storage. [8][9]
Before asking who will pay, then, we need to know what service is being bought and how its benefit will be measured.
Can fuller reservoirs replace batteries?
In part, yes, and that is one of the arguments worth taking seriously.
When solar and wind generation covers more demand during the day, hydropower plants with reservoirs can generate less in those hours and save water for other hours. Under favorable conditions, this increases available flexibility without immediately requiring another reservoir. But the relationship is not automatic: it depends on dispatch decisions, hydraulic constraints, and demand at each moment. [10]
ONS open data show a meaningful improvement in the Southeast/Central-West and the Northeast compared with the same period in 2025. On October 15, 2026, stored energy in the Southeast/Central-West reached 55.25% of the subsystem’s reference capacity, against 46.82% a year earlier. In the Northeast, the figures were 65.12% and 51.64%. [11]
The improvement was not the same everywhere. On the same date, the South fell from 90.60% to 81.28%, and the North from 78.93% to 67.58%. The situation of one reservoir or one subsystem does not describe the entire SIN. [11]
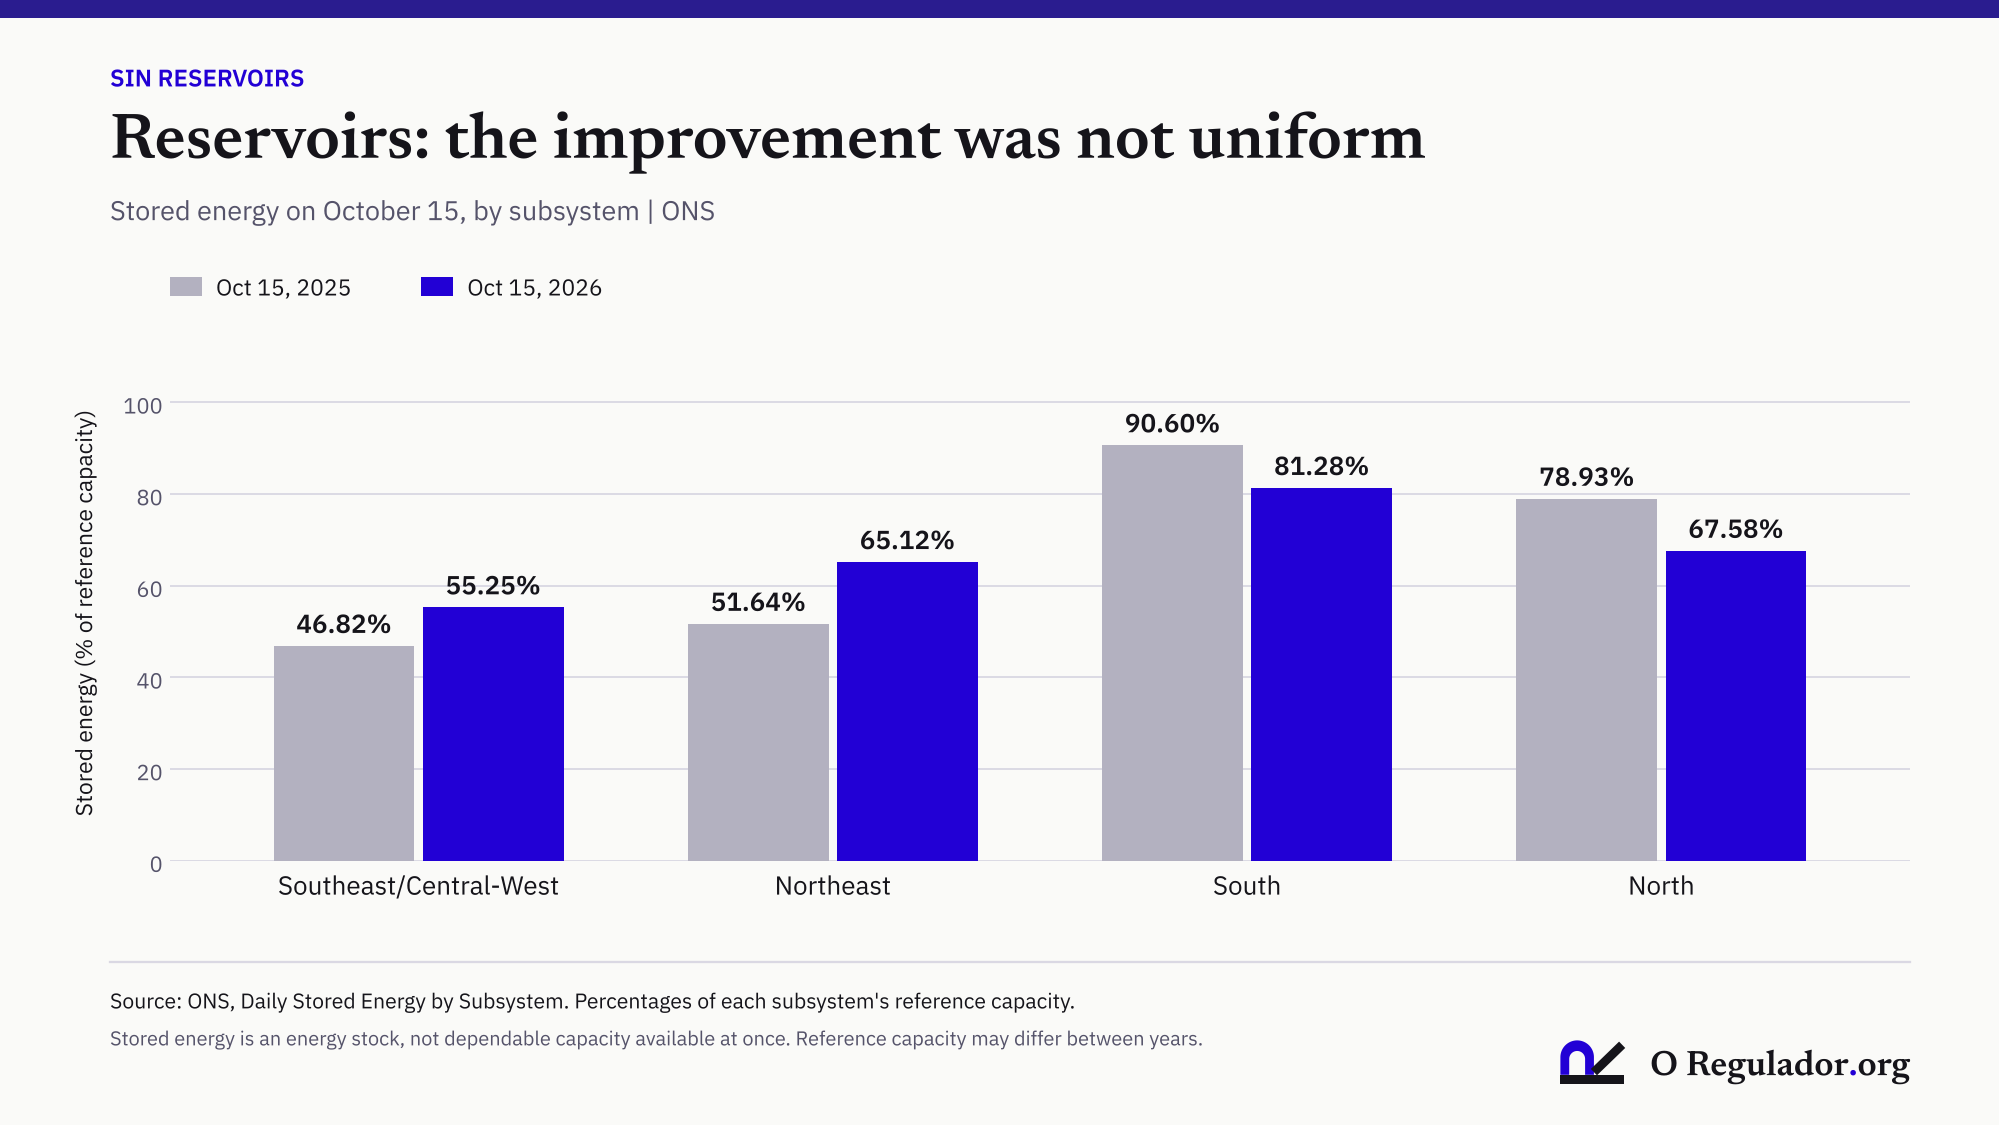
There is, then, evidence of more favorable energy conditions in important parts of the system in October 2026. But these percentages cannot tell us, without additional simulations, how many megawatts of batteries would no longer be needed, especially when the contracts start in 2028 and their obligations run for many years.
An existing hydropower plant can supply extra output in certain hours at a relatively low incremental cash cost. That does not make the service free. Water used today has an opportunity cost, because it could be saved to generate later. Then there are the limits of the generating units, transmission constraints, environmental flows, irrigation, water supply, and other uses.
A study by Simone Quaresma Brandão, Erik Eduardo Rego, and Roney Nakano Vitorino, published in September 2026, examined hydropower flexibility along the São Francisco River cascade using stochastic optimization and hourly simulations. The results point to potential benefits from coordinating hydropower and renewables, but also show the weight of water uses and environmental constraints. The configuration studied is a regional analytical representation, not a forecast of actual SIN operation. [10]
The question that matters is not whether water or batteries are better in general. It is when one can economically substitute for the other, over what duration and at what location, while keeping the same reliability criteria and respecting the other uses of water.
Does curtailment also reduce the need for capacity?
The previous article dealt with the paradox of a country that expands renewable generation and, in many hours, has to limit part of its output. The conclusion was that generation curtailment is not inefficient by definition, and that reducing it has to be weighed against the cost of transmission, storage, flexible demand, and other alternatives. The same care applies to the relationship between curtailment and capacity adequacy.
Cuts can arise from generation exceeding load, from electrical reliability requirements, or from external unavailability. The causes and the remedies are not necessarily the same. Reducing available generation in an hour of surplus does not, physically, create dependable capacity in an hour of scarcity.
There can be an indirect benefit: if an operation with strong solar output saves reservoir water, hydropower becomes more available for later periods. The net result, however, depends on hydrology, dispatch, grid limits, and whether renewable output coincides with critical moments. It is also possible that certain constraints reduce a resource’s effective contribution precisely when it would be useful.
For that reason, a higher average utilization factor for the generation that remains does not prove, on its own, that the system needs less capacity. Changing the denominator or removing output in certain hours can shift average indicators without improving reliability at the most critical moments.
Recent research calls for the same caution. A study by Guilherme Luiz Susteras and coauthors, published in January 2026, compared strategies for installing distributed batteries in Brazil and found differences between benefits to the system and the private incentives created by prices and tariffs. The outcome depends on how the equipment is operated and where it is located, and it does not justify saying that any battery will eliminate a given share of the cuts. [12]
Capacity, flexibility, and location: three different values
Two batteries with the same nameplate power and the same duration can be worth different amounts to the SIN. One may sit near a load center with a supply constraint. Another may be in a region that already has too much generation at charging time. Even when both are connected, they will not necessarily have the same effect on operation, congestion, and losses.
For the storage capacity reserve auction (LRCAP Storage 2026), EPE released the supporting calculations for its locational methodology, and ONS carried out a preliminary analysis of grid export headroom. Combined, the two point to the grid locations with system benefit and connection headroom. The technical note on remaining capacity, whose revision 1, dated October 23, was released on October 26, quantifies the margins at candidate substations, with information on physical availability and short-circuit interrupting capability. [13][14]
Three concepts need to be kept apart: technical connection headroom, the ability to deliver a given service, and the marginal economic value of that service to the system. A substation with available headroom does not show, for that reason alone, that procuring new capacity there would be efficient.
The minimum technical requirements note, revised on October 22, also sets parameters for monitoring, protection, and inverters, including voltage control, frequency control, and grid-forming operation. These features can increase storage’s contribution to grid operation, but compensation depends on the applicable obligations and mechanisms. [15]
Depending on the problem identified, the comparison of alternatives should include existing hydropower, hydropower upgrades and expansion, pumped storage, thermal plants, transmission, grid controls, and demand response. Cutting consumption in a critical hour can give the system a service that is, in part, similar to raising generation, although effects, duration, and costs differ. Brazilian law already provides for a competitive mechanism for generation and demand response in peak-demand hours. ONS, for its part, concluded in August 2026 the procurement of 344 MW of availability-based demand response in the third competitive mechanism of this kind. The 344 MW is the power of the contracted product. It does not prove that demand response fully replaces a power plant or a battery. [16][17]
The test is not to pick a winning technology in advance. It is to identify the real requirements and let technically suitable solutions compete to deliver them, within the constraints of each case.
So who should pay?
The economic debate has to begin with a legal distinction. Under the current wording of Article 3-A, paragraph 6, of Law No. 10,848/2004, as inserted by Law No. 15,269/2025, the costs of capacity reserve procured through batteries are allocated only among electricity generators, as set out in ANEEL regulations. The same article has more general rules for capacity reserve and provides, in paragraph 5, for criteria that take into account the contribution of users’ load profiles to the need for procurement. [16]
On October 27, 2026, ANEEL stated that the storage auctions follow the rule that generators bear the costs. Bill No. 3,716/2026, meanwhile, proposes repealing the battery-specific provision. As of November 5, 2026, the bill was still moving through the Chamber of Deputies under an urgency procedure. A bill is not law in force. [2][16][18]
This dispute raises three different questions. The first is who pays formally: generators or consumers, in the proportion and through the mechanism the law sets. The second is who bears the cost in practice: depending on contracts, competition, and future investment decisions, a charge initially paid by generators can reach energy prices and procurement costs over time. The third is who caused the additional need for capacity, a question of economic causation that cannot be settled just by looking at who receives the bill.
Assigning costs to a group of agents can be consistent with the cost-causation principle. But it is not enough to point out that a source sells energy without offering the same capacity at every hour. The contribution of variable sources to reliability has to be measured. And the reserve requirement also depends on the growth and shape of load, outages, hydrology, plant retirements, interconnections, and the risk standard chosen.
Nor can we conclude that consumers are necessarily paying twice just because they pay for both energy and capacity. Those are different products. Economic double payment has to be demonstrated from contracts, obligations, and the benefits actually compensated, not assumed. That does not rule out a poorly designed mechanism creating excessive charges or unjustified transfers.
There is an important regulatory tension here. Spreading the whole cost across everyone can weaken the signals for those who make decisions that raise it. Concentrating it on agents who cannot control or properly price the risk can also make useful investment more expensive or reduce competition. The design has to weigh causation, ability to influence outcomes, predictability, and legitimately assumed commitments.
How to test causation before dividing the bill
The best way to turn the causation principle into a verifiable rule is to compare counterfactual scenarios. For example: what would the capacity requirement and the total cost of serving the system be if a particular expansion in generation, demand, or transmission had not happened, with the same reliability standard?
The exercise takes more than deleting a power plant from a spreadsheet. In each scenario, the system has to be able to choose coherent expansion and operating alternatives, respecting hydrology, transmission limits, outage risks, and equivalent supply standards. Otherwise we charge one agent for the cost of a system that was artificially prevented from adapting.
A conceptual expression is the difference between the cost of the system with the change and the cost of the reference system:
ΔCsystem = Csystem with change − Creference system
This difference includes, where relevant, investment, operating, grid, and flexibility costs, and effects on reliability. It is not an official cost-allocation formula, nor an amount a generator automatically owes. The benefits of the energy produced, existing contracts, and effects on other agents also enter the picture.
Social appraisal adds another question: compared with the reference alternative, which solution gives the greatest net benefit over its useful life? In simplified form, this is the net present social value (NPSV):
NPSV = Σt=0T Bt − Ct(1 + r)t
In this expression, B stands for incremental social benefits, C for incremental costs, r for the discount rate, and T for the appraisal horizon. It can include procurement and operating costs, reliability, avoided curtailment where applicable, losses, environmental impacts, and other measurable effects. Shared services should be valued without counting the same benefits twice. [19]
A project can be financially attractive to its owner and give little benefit to the system. Another can provide an important service to the grid without receiving enough private compensation under the current design of prices and charges. Spotting that gap is part of the regulator’s job. [12]
What I consider a sound regulatory response
In my reading, Brazil’s power sector already has the technology and technical knowledge to handle these questions with more precision than a generic dispute between those who generate and those who consume allows. The challenge is to align planning, procured products, economic signals, and later evaluation of results.
Fuller reservoirs are good news, but favorable hydrology does not eliminate the risk of dry years, outages, or local constraints. Batteries offer useful attributes, but their value cannot be presumed without comparing duration, location, recharging, and alternatives. Curtailment reveals a coordination difficulty between supply and demand. By itself, it proves neither that all existing capacity is permanently in surplus nor that storage must be procured in any particular amount.
I consider it essential to demand three demonstrations before structural decisions: which physical requirement has to be met, which alternative meets it at the lowest social cost, and which cost-allocation rule preserves efficient incentives without undermining commitments legitimately made. Perhaps the debate is concentrated on the third question before the first two have been properly resolved.
The economic conclusion is not that costs should always fall on generators or always on consumers. It is that assigning costs without measuring causation can create the wrong incentives, while procuring resources without testing their marginal benefit can make the very security we are after more expensive.
The energy transition will require energy, capacity, and flexibility in combinations that change over time. Good regulation should recognize and compensate those attributes by the value they actually deliver to the system and to society.
Methodological note
The data for Figures 1 and 2 come from the ONS Energy Balance by Subsystem dataset [3]. The aggregate SIN row was used, to avoid counting the same load and generation twice, and hourly average power was converted from MW to GW. Residual load was defined only for this article, as load minus the wind and solar generation reported in the balance, which may include estimates of distributed micro- and minigeneration (micro e minigeração distribuída, MMGD). It is not the official ONS series of supervised net load.
For the comparison between October 2025 and October 2026, 31 complete days were used for each year, with 24 hourly intervals per day. The daily indicator in Figure 2 is residual load in the hour starting at 7 p.m. minus residual load in the hour starting at noon. The average of those 31 values is 30.28 GW in 2025 and 38.39 GW in 2026. The result measures the change in residual load between two fixed hours. It is not unserved power, a maximum ramp rate, a capacity deficit, or a causal estimate of the effect of any technology. ONS series may be revised and may change methodologically.
Figure 3 uses the Daily Stored Energy by Subsystem dataset [11], with percentages verified on 10/15/2025 and 10/15/2026. The indicator is the aggregate energy stock relative to each subsystem’s reference maximum. Because that maximum and operating conditions can change, a change in the percentage should not be read as an identical proportional change in the physical volume of water. Dependable capacity, ELCC, a resource adequacy balance, hydrothermal optimization, the monetary value of charges, and the causal effect of the auctions were not calculated.
The legal analysis reflects the acts and legislative status documented through November 5, 2026. The article makes no recommendation on the outcome of auctions, bills, or administrative proceedings under way. The main claims rest on primary sources and specialized literature.
Editorial independence
Although I am an ANEEL employee, I took no part internally in any of the processes discussed in this article, including the approval of the storage auction notices. This analysis uses official documents, academic studies, and public data. The interpretations and conclusions are my own and do not represent the institutional position of ANEEL or of any of the other organizations and institutions mentioned. The aim is to discuss general economic and regulatory criteria without prejudging ongoing proceedings.
References
- MME. Alexandre Silveira articula maior leilão de geração da história com economia de R$ 33 bilhões ao consumidor [Alexandre Silveira coordinates the largest generation auction in history, with R$33 billion in savings for consumers]. March 18, 2026. Result of the 2026 Capacity Reserve Auction (LRCAP): about 19 GW of capacity procured. https://www.gov.br/mme/pt-br/assuntos/noticias/2023-2026/alexandre-silveira-articula-maior-leilao-de-geracao-da-historia-com-economia-de-r-33-bilhoes-ao-consumidor. Accessed November 5, 2026.
- ANEEL. Editais nº 05/2026 e nº 06/2026 dos leilões de armazenamento de energia são aprovados pela ANEEL [ANEEL approves Auction Notices No. 05/2026 and No. 06/2026 for energy storage]. October 27, 2026. https://www.gov.br/aneel/pt-br/assuntos/noticias/2026/editais-no-05-2026-e-no-06-2026-dos-leiloes-de-armazenamento-de-energia-sao-aprovados-pela-aneel. Accessed November 5, 2026.
- ONS. Balanço de Energia por Subsistema [Energy Balance by Subsystem]. Verified hourly series. Open Data Portal. Data queried for October 18, 2026, and for every day of October 2025 and October 2026, on November 5, 2026. https://dados.ons.org.br/dataset/balanco-energia-subsistema
- NORTH AMERICAN ELECTRIC RELIABILITY CORPORATION (NERC). Evaluating Resource Contributions for Reliability and Capacity Supply. Staff report with the proceedings of a workshop held June 5 and 6, 2025. September 2025. See especially pp. iv to vi and Chapter 1, on capacity accreditation, ELCC, temporal and locational constraints, and probabilistic methods. https://www.nerc.com/globalassets/our-work/reports/special-reports/elcc_report._september_2025.pdf. Accessed November 5, 2026.
- EPE. Critério de Garantia de Suprimento [Security of Supply Criteria]. Institutional note on CNPE Resolution No. 29/2019 and MME Ordinance No. 59/2020, with the energy and capacity metrics CVaR(CMO), CVaR(ENS), LOLP, and CVaR(PNS). https://www.epe.gov.br/pt/areas-de-atuacao/energia-eletrica/modernizacao-do-setor-eletrico/criterio-de-garantia-de-suprimento. Accessed November 5, 2026.
- MACHADO, Renato Haddad Simões; REGO, Erik Eduardo. A two-dimensional adequacy mechanism for electricity markets with a high share of variable renewable sources to stimulate efficient investment and ensure reliability. Energy Policy, vol. 214, article 115211, March 2026. DOI: https://doi.org/10.1016/j.enpol.2026.115211. Content described as in the published abstract.
- LEONEL, Laís Domingues; BALAN, Mateus Henrique; REGO, Erik Eduardo; RAMOS, Dorel Soares. Assessing emerging flexibility challenges in the Brazilian interconnected system: Insights from international market experience. The Electricity Journal, vol. 39, article 107554, June 2026. DOI: https://doi.org/10.1016/j.tej.2026.107554.
- EPE. EPE publica metodologia para cálculo do preço-teto dos leilões de armazenamento de energia [EPE publishes the methodology for calculating the price cap of the energy storage auctions]. October 19, 2026. https://www.epe.gov.br/pt/imprensa/noticias/epe-publica-metodologia-para-calculo-do-preco-teto-dos-leiloes-de-armazenamento-de-energia. Accessed November 5, 2026.
- EPE. Metodologia para definição das premissas e dos parâmetros do Custo Marginal de Referência (CMR): LRCAP Armazenamento 2026 [Methodology for defining the assumptions and parameters of the Reference Marginal Cost (CMR): LRCAP Storage 2026]. Technical Note EPE-DEE-RE-081/2026, issued August 12, 2026, and revised October 14, 2026. https://www.epe.gov.br/sites-pt/publicacoes-dados-abertos/publicacoes/PublicacoesArquivos/publicacao-976/NT%20Metodologia%20Para%CC%82metros%20e%20Premissas%20CMR%20r3.pdf. Accessed November 5, 2026.
- BRANDÃO, Simone Quaresma; REGO, Erik Eduardo; VITORINO, Roney Nakano. Operational Flexibility of Hydropower Plants for Renewable Integration: Balancing Energy and Capacity Supply with Environmental and Water Use Constraints. Hydropower, vol. 1, no. 3, article 9, September 27, 2026. DOI: https://doi.org/10.3390/hydropower1030009.
- ONS. Energia Armazenada Diária por Subsistema [Daily Stored Energy by Subsystem]. Open Data Portal. Observations for October 15, 2025, and October 15, 2026, accessed November 5, 2026. https://dados.ons.org.br/dataset/ear-diario-por-subsistema
- SUSTERAS, Guilherme Luiz; MESCHINI ALMEIDA, Carlos Frederico; SALLES, Mauricio Barbosa de Camargo. Storage at the edge: Distributed BESS as a technical and regulatory solution for Brazil’s energy transition. Energy Policy, vol. 211, article 115112, January 2026. DOI: https://doi.org/10.1016/j.enpol.2026.115112.
- EPE. EPE publica memória de cálculo da metodologia locacional aplicada ao LRCAP Armazenamento 2026 [EPE publishes the supporting calculations for the locational methodology applied to LRCAP Storage 2026]. June 26, 2026. https://www.epe.gov.br/pt/imprensa/noticias/epe-publica-memoria-de-calculo-da-metodologia-locacional-aplicada-ao-lrcap-armazenamento-2026. Accessed November 5, 2026.
- ONS; EPE; ANEEL. NT-ONS DPL 0095/2026, revisão 1: quantitativos da capacidade remanescente do SIN para conexão de novos sistemas de armazenamento [Technical Note NT-ONS DPL 0095/2026, revision 1: remaining SIN capacity for connecting new storage systems]. Revision 1 dated October 23, 2026, and released October 26, 2026. https://www.epe.gov.br/pt/imprensa/noticias/epe-ons-e-aneel-revisam-nota-tecnica-com-os-quantitativos-da-capacidade-remanescente-para-conexao-de-novos-sistemas-de-armazenamento-no-lrcap-2026. Accessed November 5, 2026.
- EPE; ONS. Requisitos técnicos mínimos para o LRCAP Armazenamento 2026 [Minimum technical requirements for LRCAP Storage 2026]. Revision of NT-ONS DPL 0111/2025 / EPE-DEE-NT-095/2025, published October 22, 2026. https://www.epe.gov.br/pt/imprensa/noticias/epe-e-ons-revisam-nota-tecnica-com-os-requisitos-minimos-para-o-leilao-de-reserva-de-capacidade-lrcap-de-armazenamento-de-2026. Accessed November 5, 2026.
- BRAZIL. Lei nº 10.848, de 15 de março de 2004 [Law No. 10,848 of March 15, 2004]. Consolidated text from the Chamber of Deputies, especially Article 3-A, paragraphs 3, 5, and 6, and Article 3-E, as amended by Law No. 15,269 of November 24, 2025. https://www2.camara.leg.br/legin/fed/lei/2004/lei-10848-15-marco-2004-531234-normaatualizada-pl.html. Accessed November 5, 2026.
- ONS. Programa de Resposta da Demanda [Demand Response Program]. Institutional information and news on the 2026 competitive mechanism, including the conclusion of the procurement of 344 MW in the 3rd Availability-Based Demand Response Mechanism, on August 6, 2026. https://www.ons.org.br/paginas/energia-amanha/resposta-da-demanda. Accessed November 5, 2026.
- BRAZILIAN CHAMBER OF DEPUTIES. Projeto de Lei nº 3.716/2026 [Bill No. 3,716/2026]. Legislative tracking record. https://www.camara.leg.br/proposicoesWeb/fichadetramitacao?idProposicao=2639692. Accessed November 5, 2026.
- HM TREASURY. The Green Book (2026): Central Government Guidance on Appraisal and Evaluation. London, March 10, 2026. Sections on social cost-benefit analysis, discounting, and net present social value. https://www.gov.uk/government/publications/the-green-book–2/the-green-book-2026. Accessed November 5, 2026.
The opinions and analyses expressed in this article are personal and do not represent the institutional positions, decisions, or interpretations of the Brazilian Electricity Regulatory Agency (ANEEL).
How to cite this article
ALCÂNTARA, Márcio. Who Should Pay for the Capacity the Power System Needs?. Regulador.org, 2026. Available at: https://www.regulador.org/en/2026/11/05/who-pays-capacity/. Accessed on: Nov. 5, 2026.
Dr. Márcio Alcântara
Electrical engineer with a master's degree and a PhD from UNICAMP. A civil servant at ANEEL since 2008. Writes about regulation as a discipline: how public decisions are built, what evidence supports them, and how they can be more transparent.